
Machine Learning: Visual Identification of Damage Box
This project was developed using ".ipynb" files that were written in Portuguese, therefore, its repository contains the files in this same language.
To access the project repository, with all it's files in Portuguese, click HERE
The ".ipynb" used to develop the project is called "machine_learning_damaged_boxid.ipynb". You can also click onto the Google Colaboratoy Link for project visualization
To be able to execute the .ipynb file, it is necessary to execute a process.
- Access the Google Drive link to download "dataset-desafio" zipped folder
- Unpack the "dataset-desafio" folder
- Add the .ipynb file to the "dataset-desafio" folder
- Add the "dataset-desafio" folder to the google drive, following the procedure:
- gdrive/MyDrive/Colab Notebooks
- Inside the "dataset-desafio" folder, you will have a folder called "dataset-desafio-MEduarda" that will contain all the results presented when the program was run by me, such as images generated by augmentation, within their respective folders, and the checkpoints saved.
This page will present, in English, the project's goal, the process used to develop it and the results.
Project Goal
- The project has the goal to develop machine learning models which purpose is to identify and classify damaged packets from pictures
- Three models were generated as a comparison metric, to identify the one that best met the objective
- The data were given during the post-graduate course and the images were generated artificially
Project Development
- The technical development of this project was divided into four phases:
- Data Load
- Pre-processing data
- Model Training
- Interpretability Map
Data Load
- The data was loaded correctly, as explained above and inserted into "gdrive/MyDrive/Colab Notebooks"
- The dataset presents images of "intact" and "damaged" medicine boxes, in two directions: top and side
- The complete DataSet contains the data separated into training and test:
- The "Interpretability" folder is the folder that contains the test files. Contains a total of 20 damaged type images and 20 intact type images, half being the "top" type and half the "side" type
- The folders "DAMAGE" and "INTACT" contain the training images for damaged and intact boxes, respectively. There are 180 images of each type, being 90 "top" and 90 "side" in both cases
Pre-processing data
- The models used to train the images are pre-trained, however, before being applied, it is necessary to perform pre-processing elements on the images
- The "Pytorch transformers" was used to apply DataAugmentation in the DataSet, this provided that images, within a same category, had a greater variety, allowing better classification
- With the DataSet ready, started the process to create the training and test DataLoad, these are the elements that will be used by the model for classification
Model Training
- Three pre-trained models were used to start the classification process:
- Resnet 18D
- DenseNet 121
- SeresNet 50
- The models were obtained through Timm's Library
- Then the models were trained for 15 epochs in order to achieve good classification results
- Finally, the parameters of the models that presented the best results at a given epoch are chosen and they are saved for definition of the final model
Interpretability Map
- In addition to the provided images, the dataset also contained the bound-box for each of them
- The bound-box of the image is that region which most influences its classification
- The idea of the interpretability map is to generate, from the predicted classification of images, a heat map in order to visualize the most influential regions.
- It is considered that the model was more important/ relevant when there was a coincidence between the bound-box and the relevant regions of the interpretability map
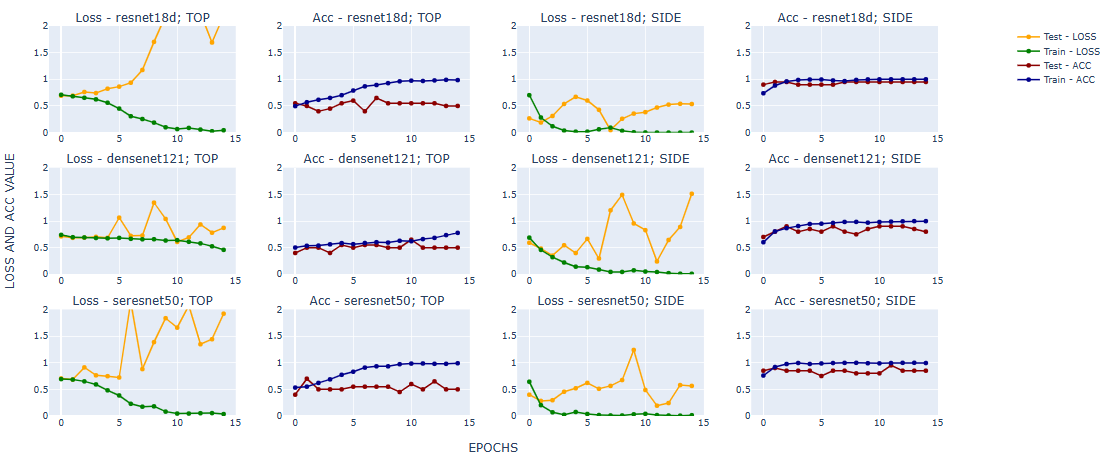
Results
- The images below represent the graphs for accuracy and loss through the epochs for all three models that exists the different positions of images (top and side)
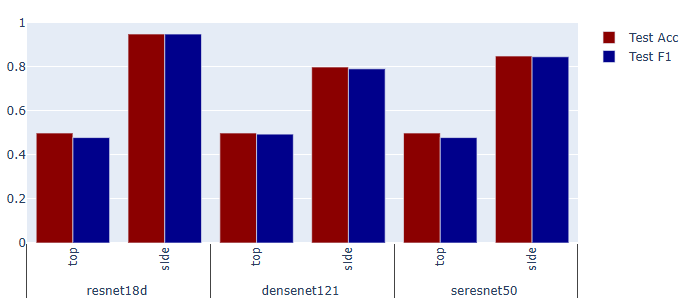
- With the parameters that presented best values at a given epoch, it is possible to obtain the accuracy and f1 values for each of the different models.
- The table and graph below present a summary of these results:
| MODEL | TOP OR SIDE | TEST ACC | TEST F1 |
|---|---|---|---|
| resnet18d | top | 0.50 | 0.479167 |
| resnet18d | side | 0.95 | 0.949875 |
| densenet121 | top | 0.50 | 0.494949 |
| densenet121 | side | 0.80 | 0.791667 |
| seresnet50 | top | 0.50 | 0.479167 |
| seresnet50 | side | 0.85 | 0.846547 |
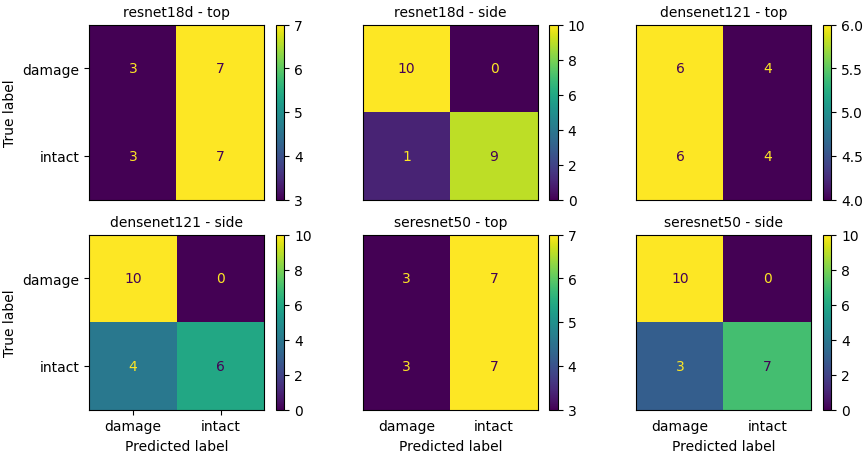
- Finally, it is possible to observe the confusion matrix for each model of classification that was generated
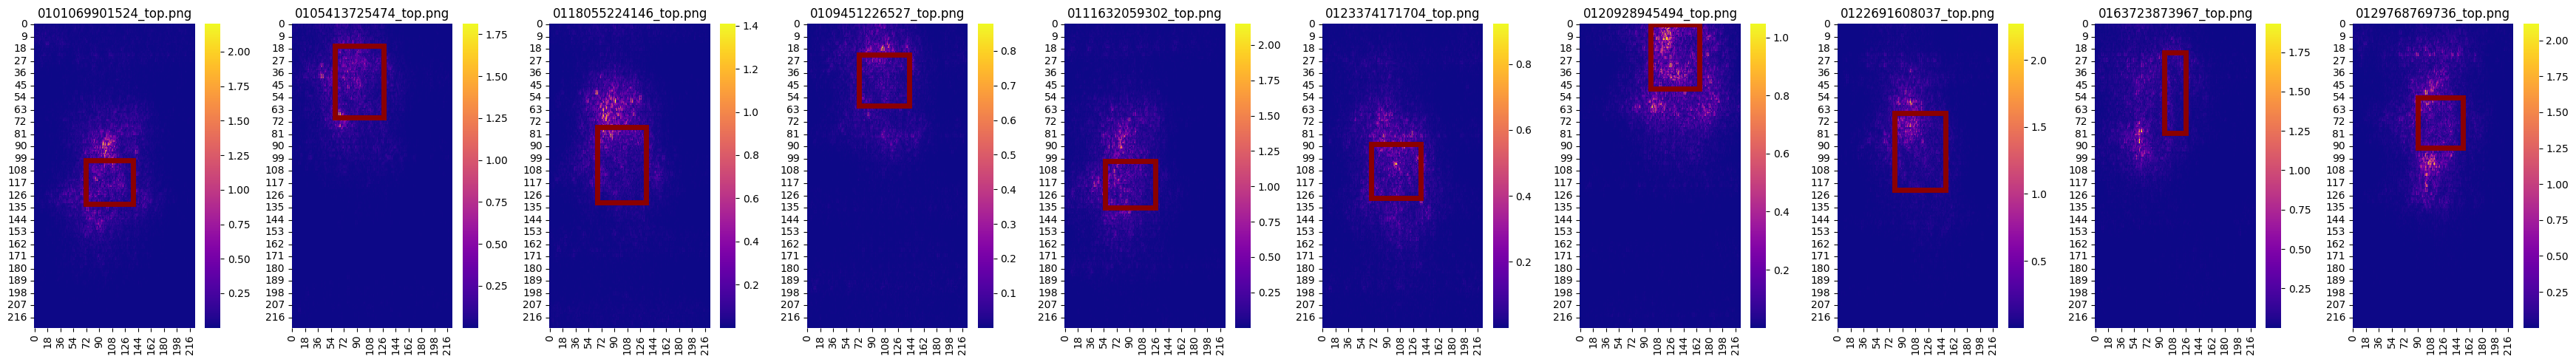
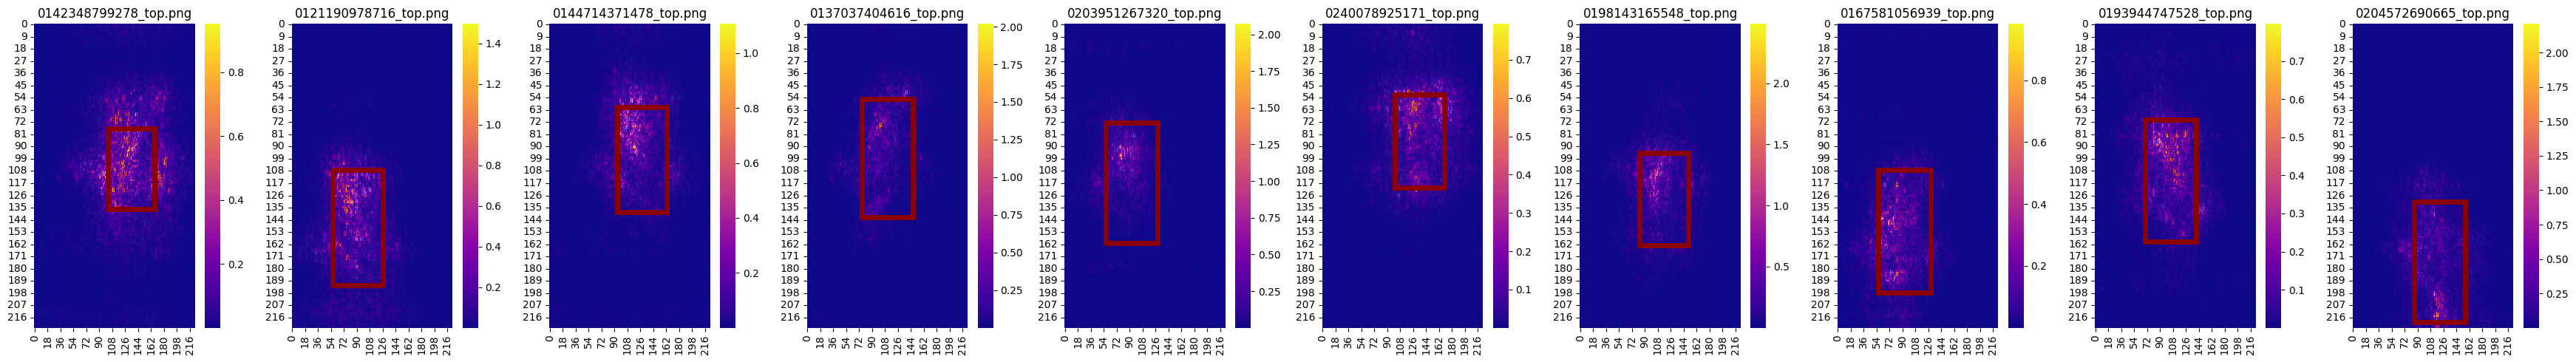
Interpretability Map
- The images below represent examples of how the bound-box fits into the original images, in the given DataSet. The first row represents the DAMAGE items, and the second, the INTACT. Both of them are from the TOP of the box.


- The Interpretability Map was made for each model that existed. Below there is a representation, for exemplification value, of the "ResNet 18D" model, from the TOP images. The first row represents the DAMAGE items, and the second, the INTACT.
Conclusion
- The Resnet18 and SeresNet50 models presented better results for the classification of the data, obtaining greater accuracy and F1 value in the test phase, having greater ease to identify elements in the side position, compared to the top position elements
- Through the confusion matrix it is observed that, for the three models, it is easier to perform the classification when the element is in the side position. In addition, the greatest difficulty of classification occurred with the elements of label intact classifying them erroneously as damage
- None of the models presented better results for top position images, as observed due to low accuracy. In addition, the Resnet and SeresNet models have a difficulty, in this case, to classify images of type damage, placing them as intact.
- Regarding the Interpretability Map, a similarity was observed between the models presented, in which the region of interest on the maps is closer to the bound-box in cases where the image is damaged. For the Intact ones, the region of interest if more different compared with the bound-box
- The models were consistent when presenting the results, regardless of the labels (damage or intact) or the seen side (top or side). While models 01 and 03 (ResNet18 and Se-ResNet50, respectively) were able to better identify the region of interest, fitting it better in the bound-box, model 02(DenseNet121) presented the worst result.
- An error that was frequent in all models and even in the variation of side, top, was the influence of the background image, in some with a greater influence than another. Often the program has identified a region of interest outside the bound-box very strong, pointing out that it was giving some importance in the background of the image and not only in the box, as should be the ideal.
- These maps can be used to test new models in the future:
- Those tests can be made to the exclusion of the image's background, before the training, so that they will not have influence in the image's decision region
- Besides that, DataAugmentation can be used to increase the amount of "INTACT" images since they were harder to identify