
Times Series: Rainfall Prediction in Recife
This project was developed using ".ipynb" files that were written in Portuguese, therefore, its repository contains the files in this same language.
To access the project repository, with all it's files in Portuguese, click HERE
The ".ipynb" used to develop the project is called "projeto_final_st_mariaEduardaNeves.ipynb". You can also click onto the Google Colaboratoy Link for project visualization
This page will present, in English, the project's goal, the process used to develop it and the results.
Project Goal
- The project has the goal to develop a Machine Learning Model that aims to predict rainfall in the city of Recife, Pernambuco - Brazil
- The data was collected through APAC, and it returns the data for a rainfall station, called "Recife (Várzea)", located in the metropolitan region of Recife.
Project Development
- The technical development of this project was divided into three phases:
- Data Load
- Pre-processing data
- Model Development
Data Load
- For the project, the only data necessary was the one collected from "APAC's" website.
- Data Description:
- Spreadsheet in ". csv" format that brings rainfall information, in the monthly style.
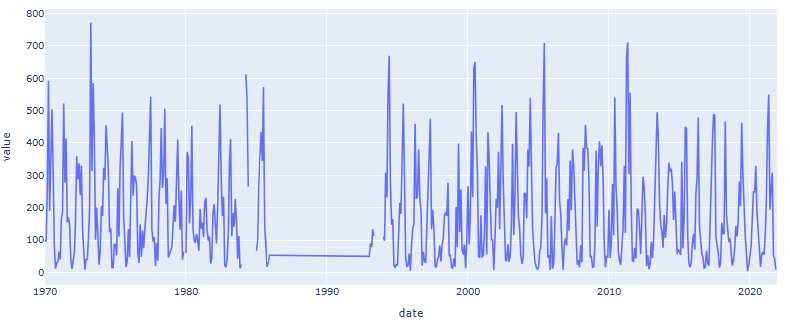
- The first year observed is 1970 and the last, 2021
- Below is presented a graph showing in the rain distribution through the years
Pre-processing data
- In this phase, some modifications were made in the data, making it proper for model implementation
- There was a gap in time (1985 - 1993), therefore, the dataset was modified so that it would start only in 1994.
- The gaps in the dataset were completed with the "ffill" function.
- The log function was implemented in the values in order to remove data asymmetry
- The values were decomposed two times in order to remove data seasonality
- Finally, the data was normalized using the MIN-MAX logic.
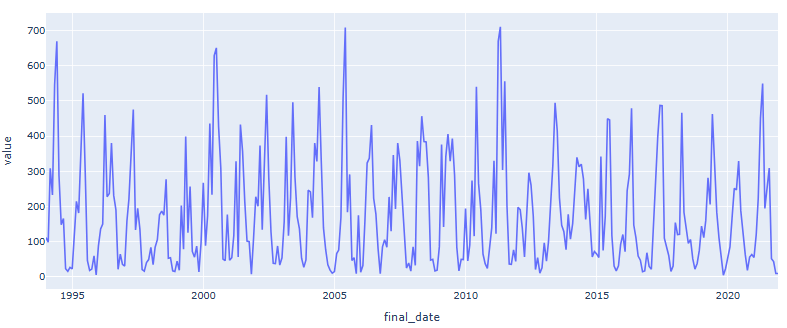
- The graph below shows the rain distribution trough the years, starting from 1994 and before any other data modification.
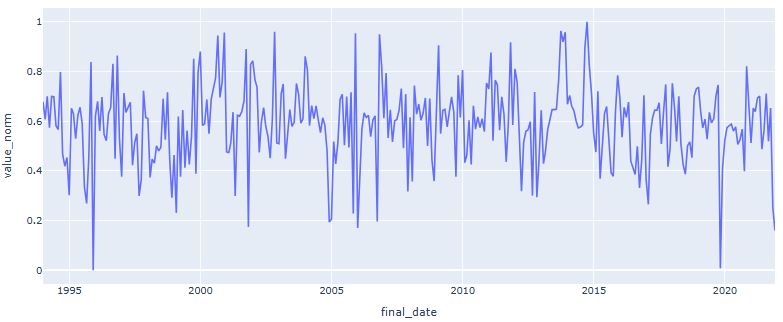
- This second graph shows the rain distribution trough the years, starting from 1994 after the data modification.
Model Development
- For this project, three models were developed, with the idea to compare the results between them and chose the one that best represented the data
- Arima Model
- MLP Model
- LSTM Model
- For all the models, the data was divided as follows:
- 50% for training
- 25% for validation
- 25% for test
ARIMA MODEL
- The ARIMA model is an Autoregressive Integrated Moving Average
- It predicts future value based on:
- Past Values (AR)
- Differentiation to achieve Stationary values (I)
- Past errors to improve predictions (MA)
- It receives three parameters for its calculation:
- P - autoregressive parameter
- D - Differentiation Parameter
- Q - Moving Average Parameter
- The Box & Jenkins methodology was used to validate the parameters chosen
MLP & LSTM MODEL
- For both models, it was used a "sliding window" to create new data. This methodology chooses an amount of past values and add as new information to the actual rainfall data.
- Besides that, for both models it was used a Grid Search method to look for the model's parameters that presented the best results.
- MLP is a "Multilayer Perceptron" model. For this project, it was used "MLPRegressor" from "sklearn.neural_network"
- LSTM is a "Long Short-Term Memory Network". It is different from MLP by being a 2D model, therefore it is necessary to flatten its data. In this case, it was used as a sequential model, followed by a LSTM layer, with the parameters that were chosen, and, for last, a dense layer.
Results
Comparison between the three models
- Bellow, it is presented a table with the metrics results presented by the models
| Models | RMSE validation | RMSE test | MAE validation | MAE test | R2 validation | R2 test |
|---|---|---|---|---|---|---|
| ARIMA (0,0,2) | 113.89 | 104.12 | 75.79 | 72.08 | -0.0603 | 0.4723 |
| MLP | 108.53 | 100.38 | 71.96 | 69.80 | 0.1235 | 0.4550 |
| LSTM | 110.06 | 102.46 | 73.41 | 71.38 | 0.0591 | 0.4234 |
- Bellow, it is presented the graphs generated by each model, side by side
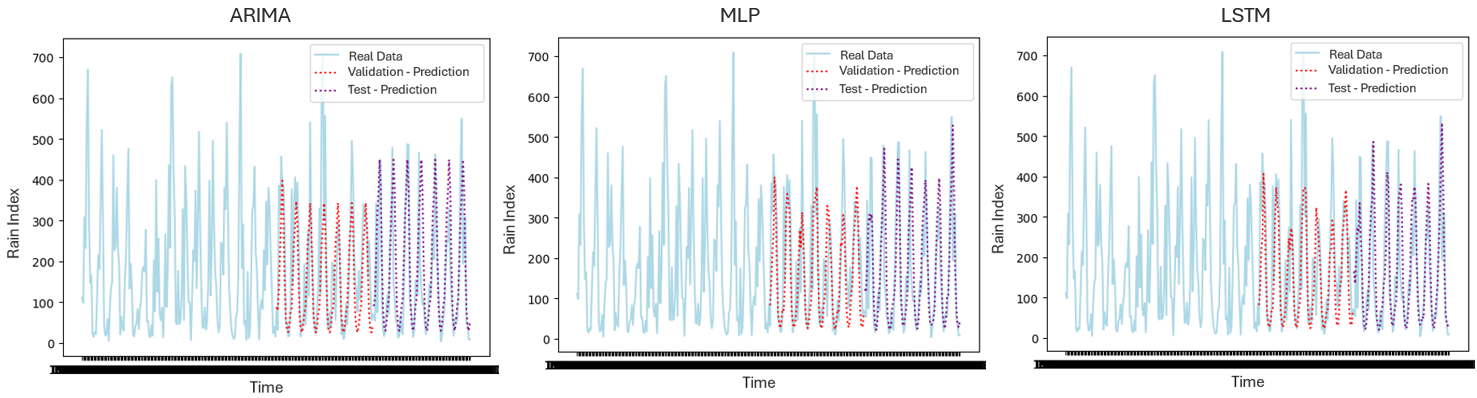
- According to the results, the MLP model presented best general metrics
- It's results were very similar to the LSTM model, but the difference was the superiority in the validation phase.
Conclusion
- Comparing the metrics obtained and the graphs generated, it is possible to conclude the model that best adapted itself to the data was MLP.
- The results show that the models find difficulty in predicting the values of rainfall peaks
- The difficulty can be related to the data type. There are a lot of outliers that were found in the model